Monitoring and Graphing Liferay with MRTG
MRTG (The Multi Router Traffic Grapher) is usually used to monitor SNMP enabled network devices and draw graphs of how much traffic has passed through each interface. It can also be used to graph any two values (in/out) and I use it for graphing cpu usage, loadavg, iowait, used memory, disk space and temperature sensor values that I can read through SNMP. Liferay however doesn’t support SNMP so I developed a perl script that can read JMX MBean values using JMX4Perl and Jolokia. I’m going to assume you have JMX4Perl and Jolokia setup already the way I describe it in my earlier post: Monitoring Liferay with Nagios, Jolokia and JMX4Perl. You should also note that MRTG won’t send you any alerts so it’s a good idea to setup Nagios to do just that.
Now you might wonder why would you need MRTG if you already have Nagios. Nagios operates on the present value although there’s a add-on nagios grapher that can create graphs like MRTG does but I like MRTG more because you can see all the graphs on one page. Being able to see a full overview of the system is very important when trying to identify performance problems. This is also why you want to get more information out of the application, Liferay in this case. My script will help in reading connection pool and thread pool utilization as well as heap usage. Those are essential when doing troubleshooting.
First you’ll need to install and setup MRTG. I’m not going to go into details on that because it dependes on your system and the internet is full of guides to do it. Once you have it done you’ll need to download my mrtg-jmx4perl.pl script which is available in my github repository. For rest of this post I’m going to assume it’s located in /usr/local/bin/mrtg-jmx4perl.pl but it’s up to you where you put it. Just adjust the script path accordingly.
Monitoring c3p0 connection pool
Getting the values for c3p0 is a little bit tricky because it will generate a unique mbean name based on the identity token it generates for the connection pool every time the server is started. Because of this my script assumes you only have one c3p0 connection pool if you have multiple pool you’ll need to add additional logic in to the mrtg-jmx4perl to find the correct mbean. Notice that this is the case if you configure Liferay to use connection pool from portal-ext.properties instead of using a JNDI resource. We can read the mbean for c3p0 by using mbean name as “com.mchange.v2.c3p0:type=*,*” and the attributes we are most interested are numConnectionsAllUsers and numBusyConnectionsAllUsers. Below is a sample mrtg configuration snippet.
Target[dbpool]: `/usr/local/bin/mrtg-jmx4perl.pl --server=servername --mbean="com.mchange.v2.c3p0:type=*,*" --attribute="numConnectionsAllUsers numBusyConnectionsAllUsers"`
MaxBytes[dbpool]: 20
Title[dbpool]: DB Pool
PageTop[dbpool]: <h1>DB Pool</h1>
WithPeak[dbpool]: dwmy
Unscaled[dbpool]: dwmy
Options[dbpool]: growright,unknaszero,nopercent,gauge
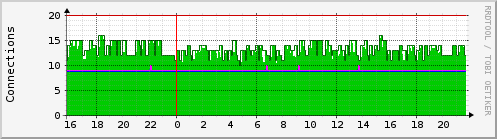
YLegend[dbpool]: Connections
ShortLegend[dbpool]:
LegendI[dbpool]: Connections
LegendO[dbpool]: Busy Connections
Legend1[dbpool]: Connections
Legend2[dbpool]: Busy Connections
Legend3[dbpool]: Peak Connections
Legend4[dbpool]: Peak Busy ConnectionsHere’s a daily graph from one of my Liferay portal servers.
Monitoring Tomcat AJP Thread Pool
This one is pretty easy because the the mbean name is static but it does vary depending on do tomcat version and connector you are using. In Tomcat 7 with native library the name for ajp thread pool is Catalina:type=ThreadPool,name=”ajp-apr-8009″. Without native library it would be ajp-bio-8009. In tomcat 6 my ajp pool mbean name is Catalina:type=ThreadPool,name=jk-8009. Notice the lack of double quotes in the name. You can easily check the name using jconsole. So for this one the config looks like:
Target[ajp-threadpool]: `/usr/local/bin/mrtg-jmx4perl.pl --server=servername --mbean="Catalina:type=ThreadPool,name=\"ajp-apr-8009\"" --attribute="currentThreadCount currentThreadsBusy"`
MaxBytes[ajp-threadpool]: 50
Title[ajp-threadpool]: AJP Thread Pool
PageTop[ajp-threadpool]: <h1>AJP Thread Pool</h1>
WithPeak[ajp-threadpool]: dwmy
#Unscaled[ajp-threadpool]: dwmy
Options[ajp-threadpool]: growright,unknaszero,nopercent,gauge
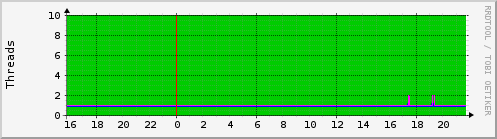
YLegend[ajp-threadpool]: Threads
ShortLegend[ajp-threadpool]:
LegendI[ajp-threadpool]: Threads
LegendO[ajp-threadpool]: Busy Threads
Legend1[ajp-threadpool]: Threads
Legend2[ajp-threadpool]: Busy Threads
Legend3[ajp-threadpool]: Peak Threads
Legend4[ajp-threadpool]: Peak Busy ThreadsHere’s a daily graph of a thread pool.
Monitoring Heap Usage
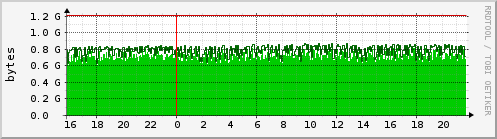
The last one we are going to monitor is Java Heap usage. It can be read from java.lang:type=Memory using attribute HeapMemoryUsage and path used. Now we are reading only one value.
Target[heap]: `/usr/local/bin/mrtg-jmx4perl.pl --server=servername --mbean="java.lang:type=Memory" --attribute="HeapMemoryUsage" --path="used"`
MaxBytes[heap]: 1296302080
Title[heap]: Heap
PageTop[heap]: <h1>Heap</h1>
WithPeak[heap]: dwmy
Unscaled[heap]: dwmy
Options[heap]:  growright,unknaszero,nopercent,gauge,noo
YLegend[heap]: bytes
ShortLegend[heap]:
kilo[heap]: 1024
LegendI[heap]: Used
Legend1[heap]: Used
Legend3[heap]: Peak Used
Here’s a daily graph of heap memory usage.
You can download the full sample-mrtg.cfg from github.
That’s how easy it is to monitor and graph Liferay or pretty much any Java webapp using MRTG. You could easily use this to monitor ehcache utilization or anything else that’s accessible via JMX.


