Monitoring with New Relic
New Relic is a wonderful software analytics suite that is 100% SaaS. I love it because it’s so easy to setup compared to Nagios, MRTG and other on premise software. Also their Lite edition is free with 24 hour data retention and for 30 days you’ll get to see the power of the Pro version. I still use nagios for my main monitoring and create some key graphs with MRTG but the data junkie in me loves all the data New Relic gathers and shows in nice graphs.
New Relic has seven parts or products as they call them. Those are APM, Insights, Mobile, Browser, Synthetics, Servers and Plugins. I have myself used only APM, Browser, Server and Plugins which are included in the free Lite edition.
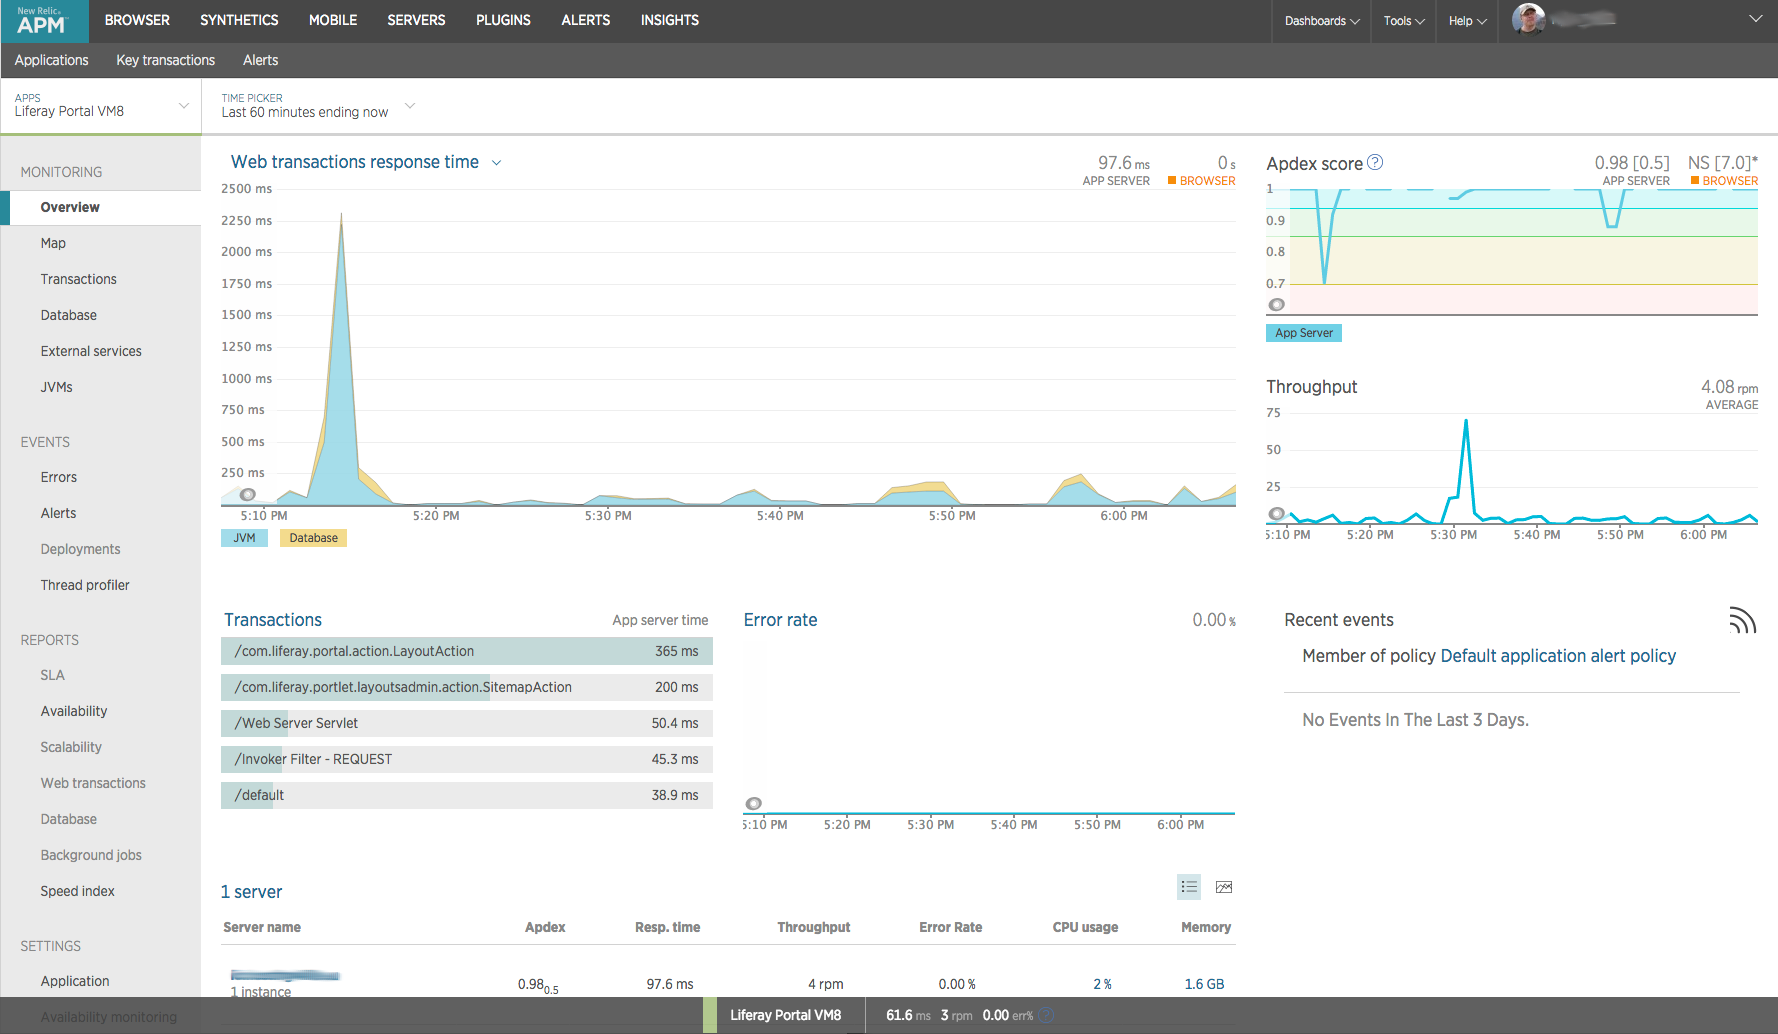
APM
APM is the application monitoring part. It focuses on providing information about the application itself. The Lite edition shows you response times, throughput, web transaction information. It’s basically a low impact profiler. With the Pro subscription you get much deeper analysis of time spent on executing SQL, JVM statistics etc.
Browser
The browser provides insights on client side performance. Even though your application might respond quickly the users perceived performance could be poor because of network performance or even how the page is rendering on the browser.
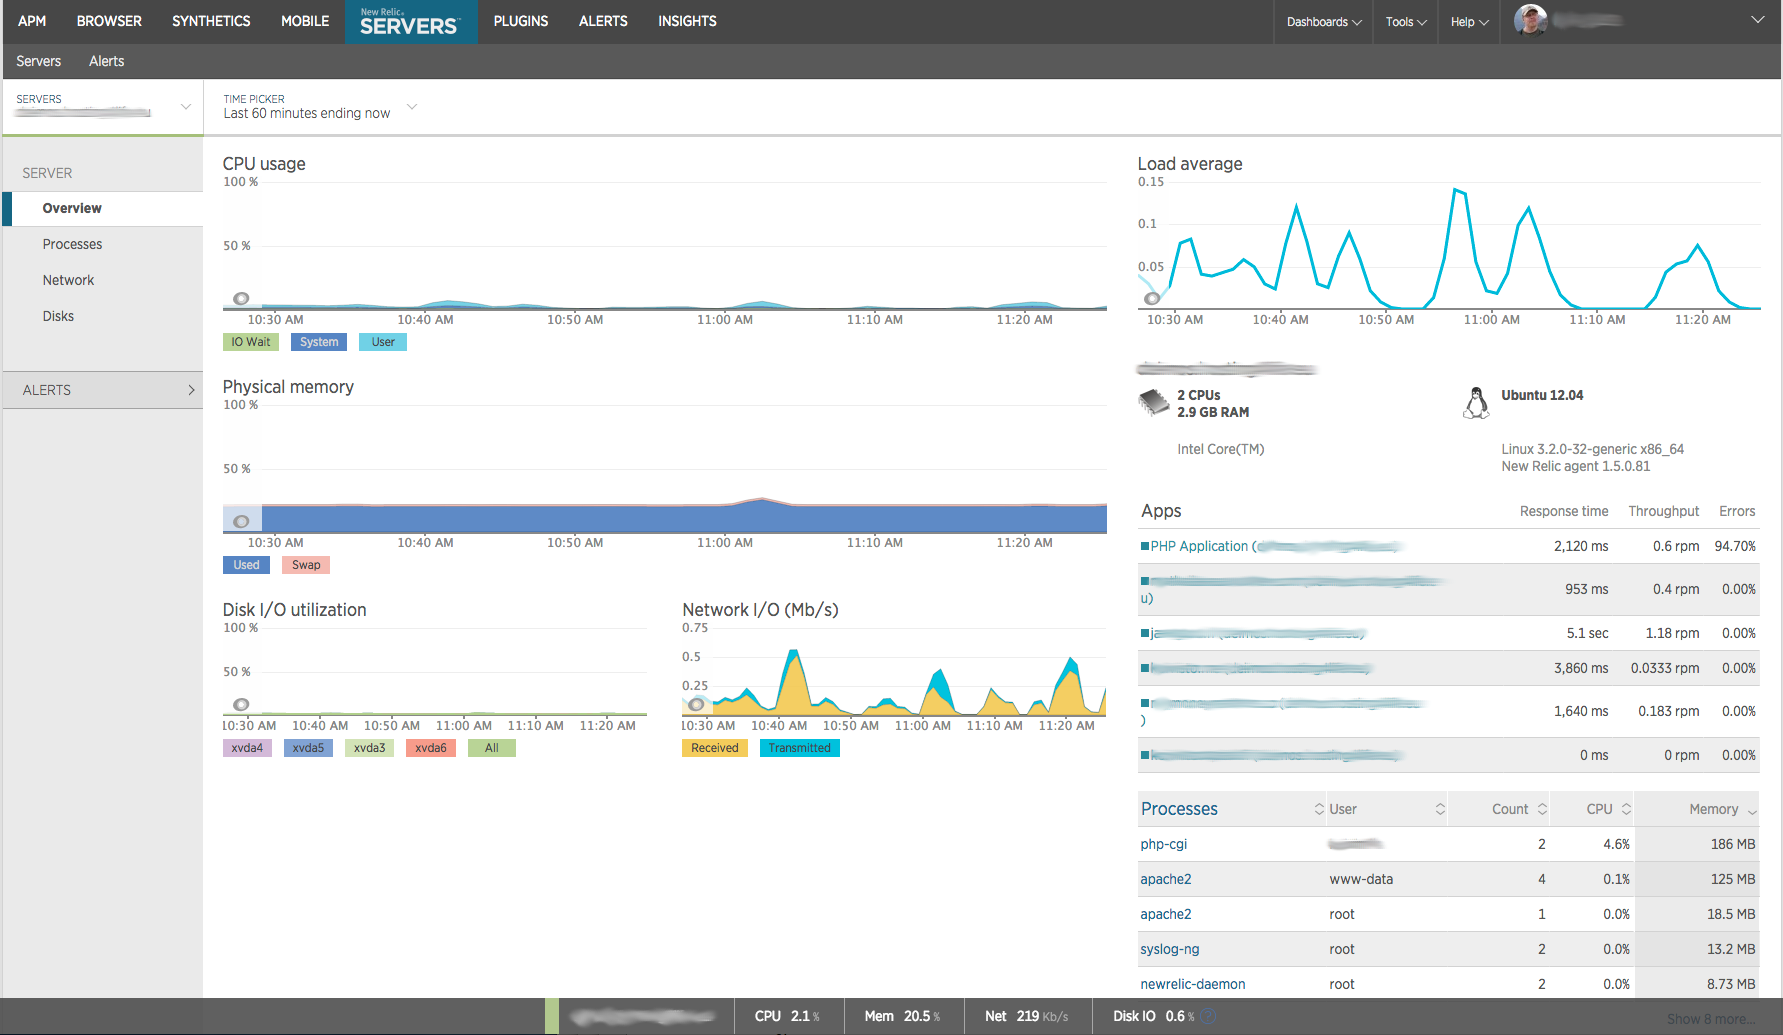
Servers
Servers as the name suggests provides performance information about the actual server your applications are running on.
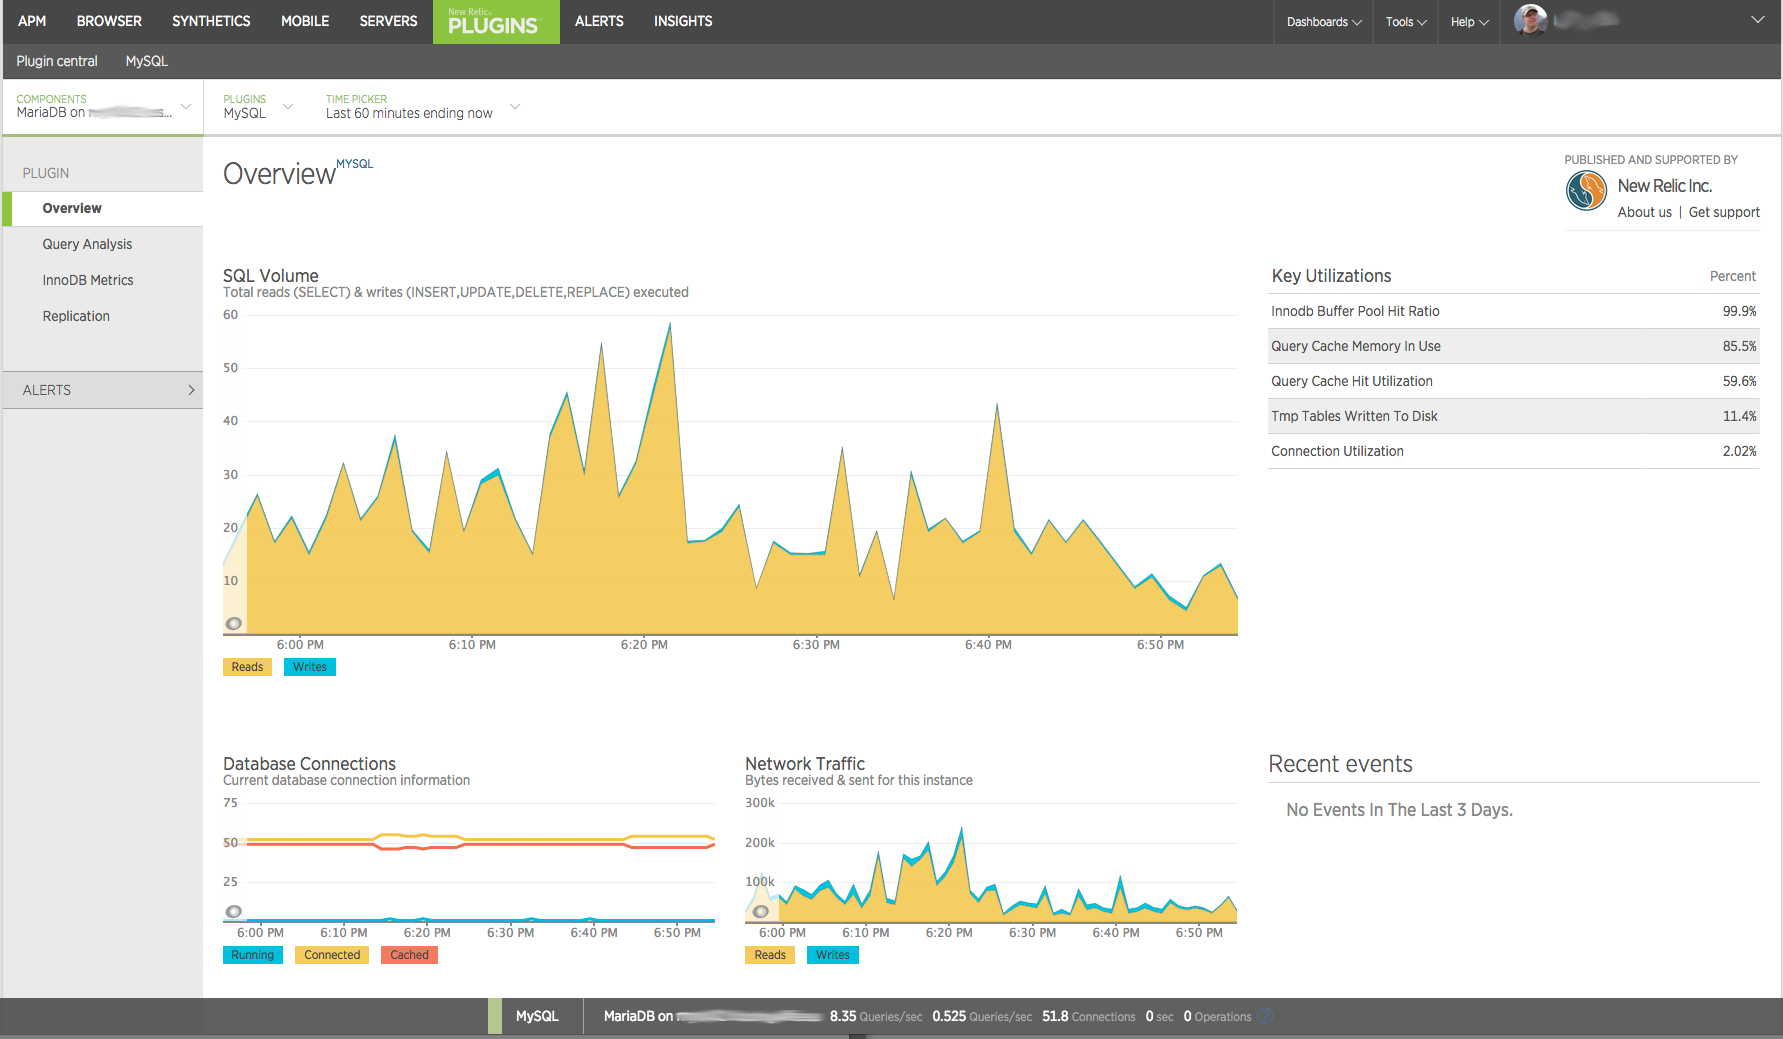
Plugins
There’s a ton of plugins to provide monitoring capabilities to systems not otherwise supported by New Relic and with it’s SDKs and API you can build your own plugins. Some of the plugins I have used are for MySQL/MariaDB, Nginx and Apache.
Mobile
Mobile is APM for mobile applications.
Synthetics
Synthetics allows you to test your application from around the world. It can check business critical user flows and interaction to make sure your site available and functioning from around the world.
Insights
Insights is a paid feature that combines business metrics with performance data. It can combine data from APM, Browser, Mobile and Synthetics for deeper analysis and segmentation and filtering.
Since I recently installed bunch of new servers and I had to refresh my memory on how I installed and configured each of the agents so I decided to write a series of articles on each of them. Here’s a list of topics I’m going to publish and as I publish them I’ll link the topic to the article. These topics will cover APM with Java and PHP, Servers and Plugins for MySQL, Nginx and Apache
- Monitoring Ubuntu / Debian Servers
- Monitoring MariaDB / MySQL
- Monitoring Nginx
- Monitoring Apache
- Monitoring Tomcat
- Monitoring PHP Applications